Your fractional CFO should track specific metrics that directly impact your business growth and profitability. Companies with strong financial tracking see 23% higher revenue growth than those without systematic measurement.
At Bette Hochberger, CPA, CGMA, we know that fractional CFO metrics fall into three categories: financial performance, operational efficiency, and strategic growth indicators. These measurements transform raw data into actionable business intelligence.
Which Financial Metrics Drive Real Business Results
Revenue Growth Rate Shows Business Momentum
Revenue growth rate stands as the primary indicator of business momentum, yet monthly growth percentages without context lead to poor decisions. Smart fractional CFOs analyze growth patterns over 12-month periods and identify seasonal trends and market cycles that impact performance. Only one in eight companies achieved more than 10 percent revenue growth annually in the last ten years.
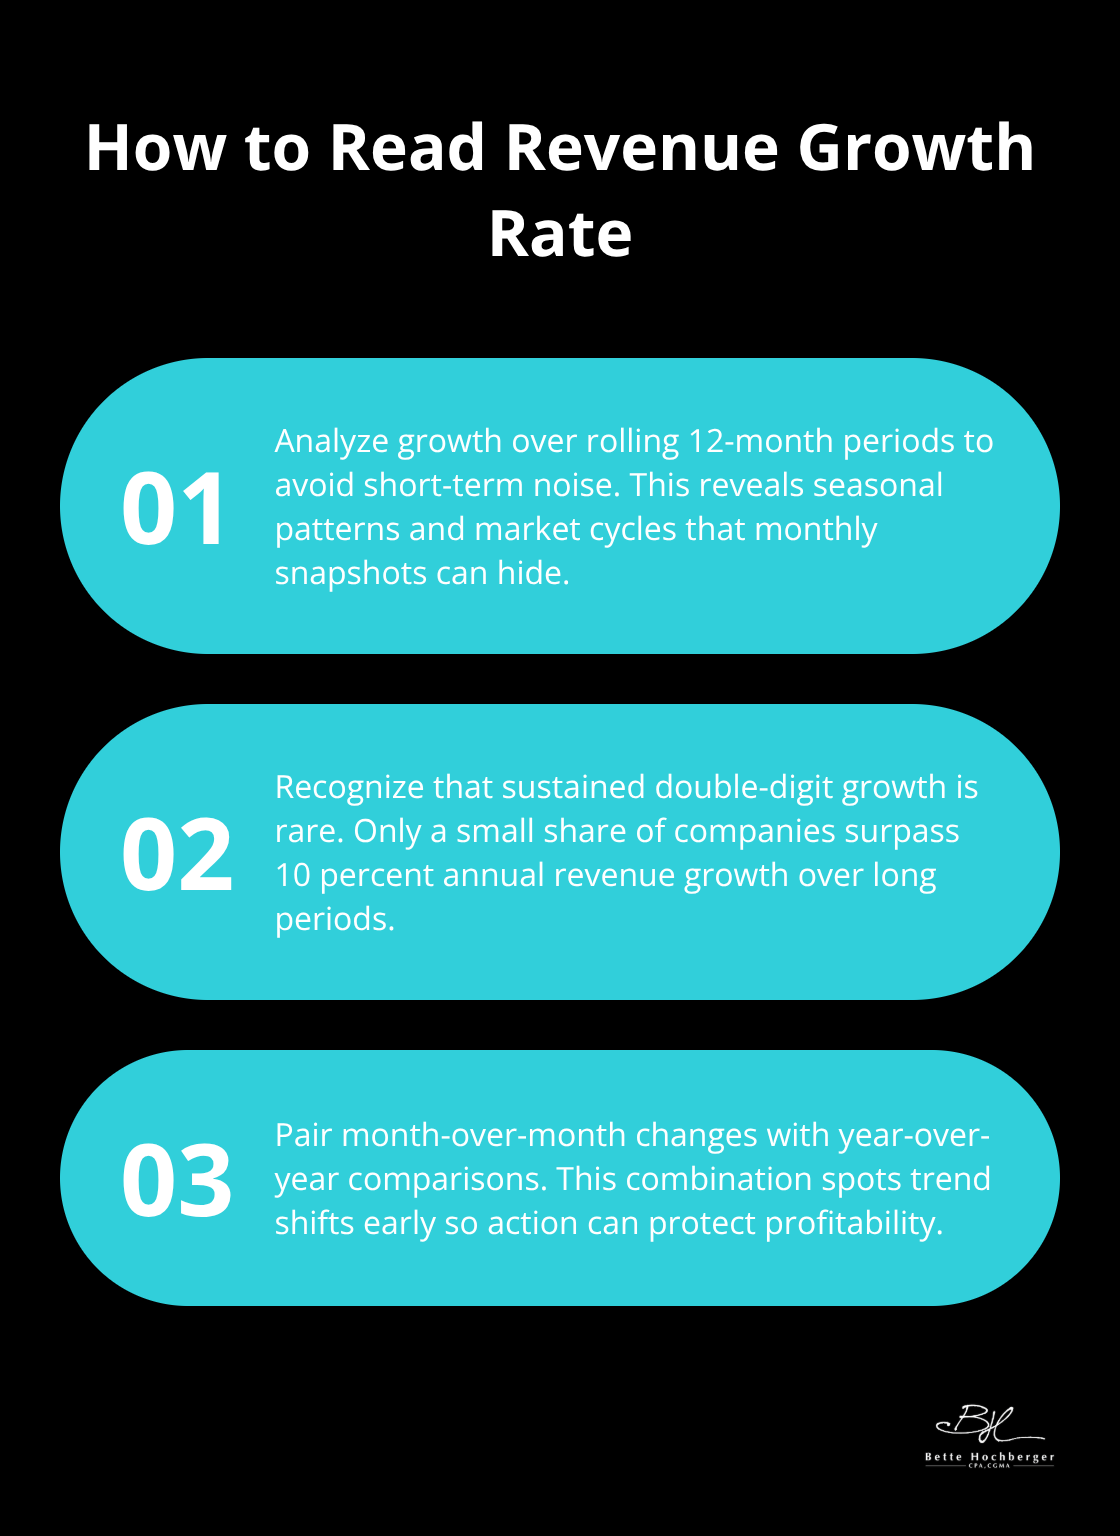
The key metric involves month-over-month growth calculations alongside year-over-year comparisons to spot trends before they damage profitability.
Gross Profit Margin Reveals Operational Health
Gross profit margin calculation requires precise cost of goods sold measurement against total revenue, with successful businesses that maintain margins above 60% in service industries and 40% in product-based companies. Fractional CFOs monitor margin erosion monthly, as a 5% decline signals price problems or cost inflation that demands immediate action. Businesses with margins that decline lose 31% more market value within six months compared to those that maintain stable margins. Track direct costs separately from overhead expenses to identify specific areas that drive margin compression and implement targeted cost reduction strategies.
Cash Flow Forecasts Prevent Business Failure
Operating cash flow measurement prevents the 82% of business failures caused by poor cash management. Effective fractional CFOs create 13-week cash flow forecasts (updated weekly) based on actual collections and payment schedules. Accounts receivable turnover ratios above 12 times annually indicate healthy collection processes, while ratios below 6 suggest payment delays that threaten liquidity. Days sales outstanding should remain under 30 days for optimal cash conversion, with anything that exceeds 45 days that requires aggressive collection efforts and revised credit policies.
These financial performance metrics provide the foundation for operational efficiency measurements that reveal how well your business converts resources into results.
How Do Operational Metrics Reveal Business Efficiency
Working Capital Ratios Expose Hidden Cash Problems
Working capital ratios expose the truth about operational efficiency that many businesses ignore until cash problems force difficult decisions. Current ratio calculations divide current assets by current liabilities, with healthy businesses maintaining optimal ratios for their specific industry requirements. Quick ratios exclude inventory and provide clearer liquidity pictures, as inventory conversion takes time and creates cash flow gaps. Companies with current ratios below 1.0 face immediate solvency risks, while ratios above 4.0 suggest excess cash that could generate better returns through strategic investments.
Collection Efficiency Determines Cash Availability
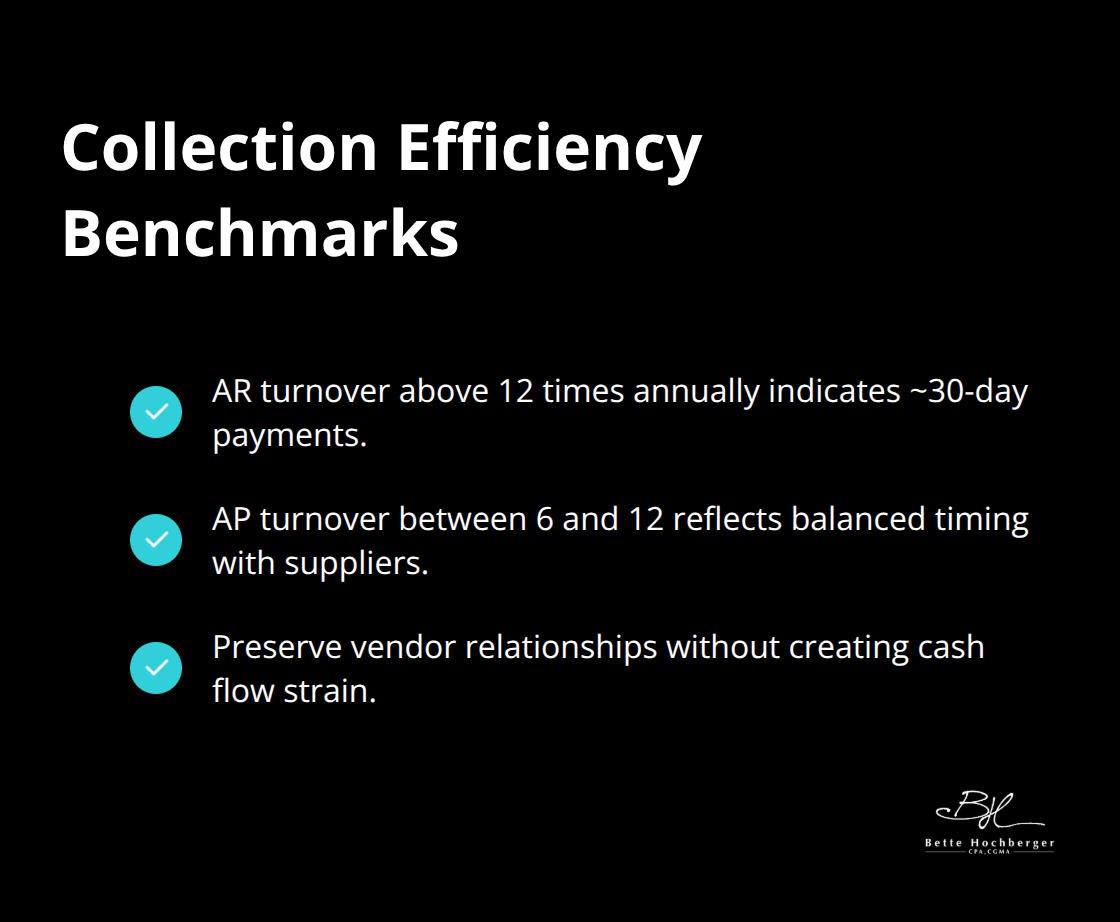
Accounts receivable turnover measurements reveal collection efficiency that directly impacts cash availability for growth opportunities. Strong performers achieve turnover rates above 12 times annually, which means customers pay within 30 days on average. Payable turnover ratios help optimize supplier relationships and cash timing, with ratios between 6 and 12 that indicate balanced payment schedules. These ratios preserve vendor relationships without cash flow strain.
Inventory Management Controls Working Capital
Inventory turnover rates above 8 times annually show efficient stock management, while rates below 4 signal overstock problems that tie up working capital. Days inventory outstanding calculations identify slow-moving products that drain resources, representing the average number of days a company holds inventory before selling it and showing how quickly it turns inventory into cash. Smart fractional CFOs track these metrics weekly to prevent inventory buildup that suffocates cash flow and reduces profitability margins.
These operational efficiency measurements connect directly to strategic growth indicators that determine long-term business success and market position.
Which Strategic Metrics Predict Long-Term Success
Customer Acquisition Cost Determines Marketing Efficiency
Customer acquisition cost analysis demands precision that most businesses ignore until marketing expenses spiral out of control. Effective customer acquisition cost calculations include all marketing expenses, sales salaries, and overhead costs divided by new customers acquired during specific periods.
Companies with customer acquisition costs below $200 per customer in B2B services achieve higher profit margins than those that spend above $500 per customer. Customer lifetime value measurements must account for retention rates, average purchase values, and gross margins over actual customer relationships rather than theoretical projections.
Lifetime Value Ratios Guide Sustainable Growth
The lifetime value to customer acquisition cost ratio should exceed 3:1 for sustainable growth, with ratios below 2:1 that signal unsustainable marketing spend and threaten long-term viability. Smart fractional CFOs track these ratios monthly to prevent marketing waste that destroys profitability.
Marketing return on investment calculations require attribution tracking across all channels, with digital marketing ROI above 400% that indicates effective campaign management. Companies that maintain these ratios see better cash flow performance compared to those with poor customer economics.
Return on Investment Analysis Separates Winners from Losers
Return on investment analysis separates successful fractional CFO engagements from expensive consulting relationships that drain resources without measurable results. Project-specific ROI calculations help businesses evaluate which initiatives generate real value versus those that consume capital without returns.
Investment decisions based on ROI analysis (rather than gut feelings) produce better outcomes according to financial performance studies. Track ROI across different business areas to identify which investments drive growth and which ones waste resources.
Budget Variance Tracking Prevents Cost Overruns
Budget variance tracking identifies spending patterns that deviate from planned allocations, with variances that exceed 15% in any category demanding immediate investigation and corrective action. Monthly variance reports should highlight specific line items where actual expenses exceed budgeted amounts.
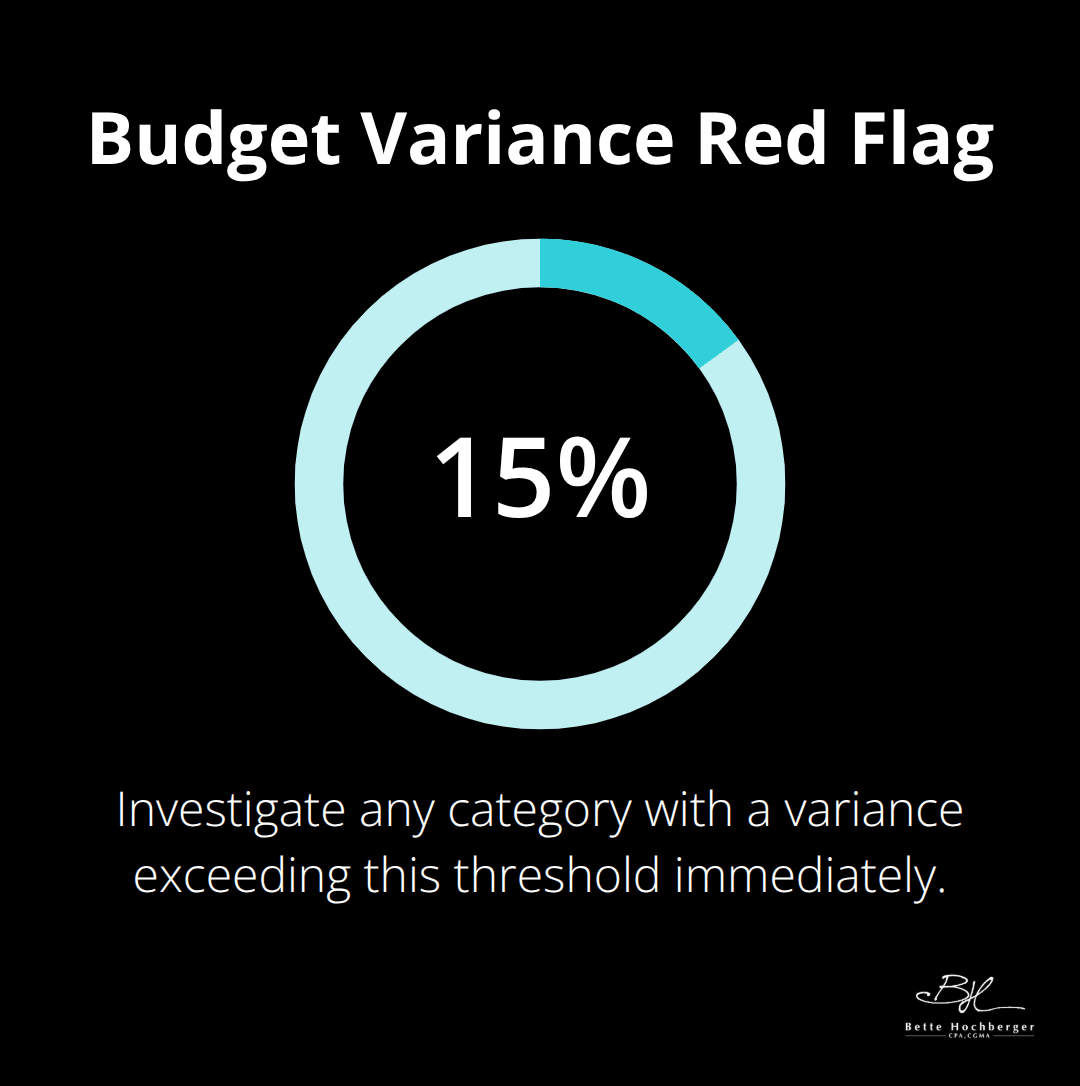
This enables quick responses to cost overruns before they impact quarterly performance. Businesses that track variances weekly catch problems faster than those that review monthly, preventing small issues from becoming major financial disasters that require proper bookkeeping to resolve.
Final Thoughts
These fractional CFO metrics create the foundation for data-driven business decisions that separate successful companies from those that struggle with cash flow and profitability challenges. Revenue growth measurement, gross profit analysis, and cash flow forecasts prevent the financial disasters that destroy 82% of businesses within their first five years. Working capital ratios and collection efficiency measurements reveal operational problems before they become cash crises.
Customer acquisition costs and lifetime value calculations guide marketing investments that generate sustainable growth rather than expensive customer churn. The real value emerges when fractional CFOs transform these measurements into actionable strategies. Budget variance measurement catches cost overruns early, while ROI analysis identifies which investments drive actual returns versus those that waste capital.
Companies that track these metrics consistently achieve 23% higher revenue growth than those that rely on intuition alone. At Bette Hochberger, CPA, CGMA, we help businesses implement systematic metric measurement that improves decision-making speed and accuracy. The difference between business success and failure often comes down to measuring what matters and acting on the insights these numbers provide (rather than guessing about financial performance).


