
Cash flow ratios reveal the true financial health of your business beyond what profit margins show. These metrics track how well your company generates and manages actual cash.
At Bette Hochberger, CPA, CGMA, we see businesses make costly decisions based on misleading profit data while ignoring cash flow warning signs. Understanding these ratios prevents financial surprises and guides smarter growth strategies.
Why Cash Flow Ratios Matter More Than Profit
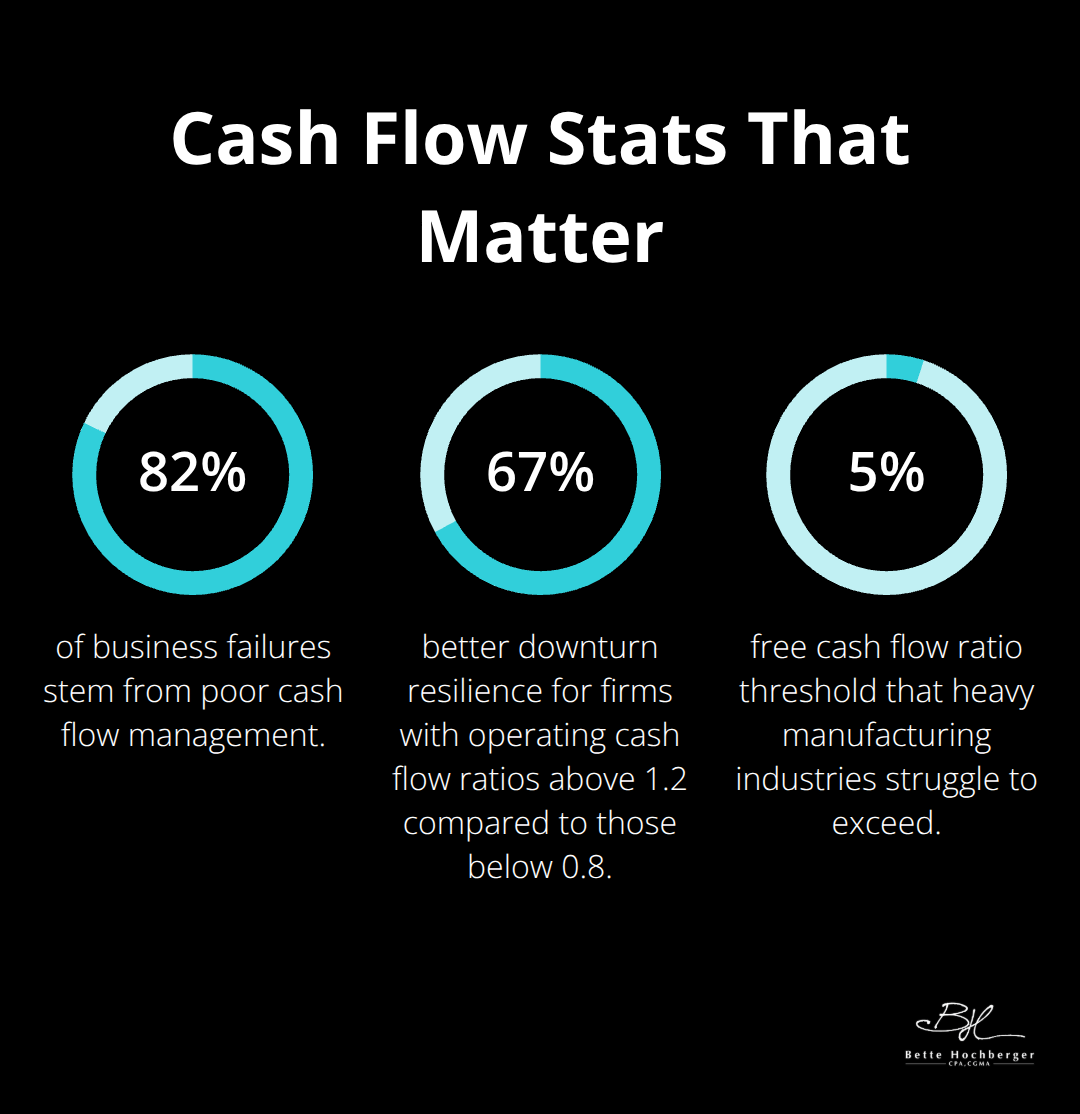
Cash flow ratios measure the actual money that moves through your business operations, not just accounting profits on paper. These metrics track three fundamental areas: operating cash generation, debt coverage capability, and free cash available for growth investments. 82% of business failures stem from poor cash flow management, which makes these ratios your early warning system against financial distress.
The Profit Illusion Problem
Profit-based metrics mislead business owners because they include non-cash items like depreciation and accounts receivable. A company can show strong profits while it struggles to pay bills due to timing differences between sales recognition and cash collection. Businesses with positive net income still face cash shortages during their first five years, particularly in service industries. Cash flow ratios eliminate this accounting noise as they focus exclusively on actual cash movements.
Strategic Decision Impact
Strong cash flow ratios directly influence your strategic options and operational flexibility. Companies with operating cash flow ratios above 1.2 can weather economic downturns 67% better than those below 0.8, according to McKinsey research. These ratios determine your ability to invest in growth opportunities, handle unexpected expenses, and negotiate better terms with suppliers and lenders.
Lending and Credit Considerations
Banks use cash flow ratios as primary criteria when they evaluate loan applications (often weighing them more heavily than profit margins). Lenders focus on your ability to generate consistent cash rather than paper profits that may never materialize. This emphasis on cash generation becomes even more important as interest rates fluctuate and credit standards tighten across different market cycles.
Now let’s examine the specific ratios that provide the clearest picture of your business’s financial health.
Key Cash Flow Ratios for Business Health
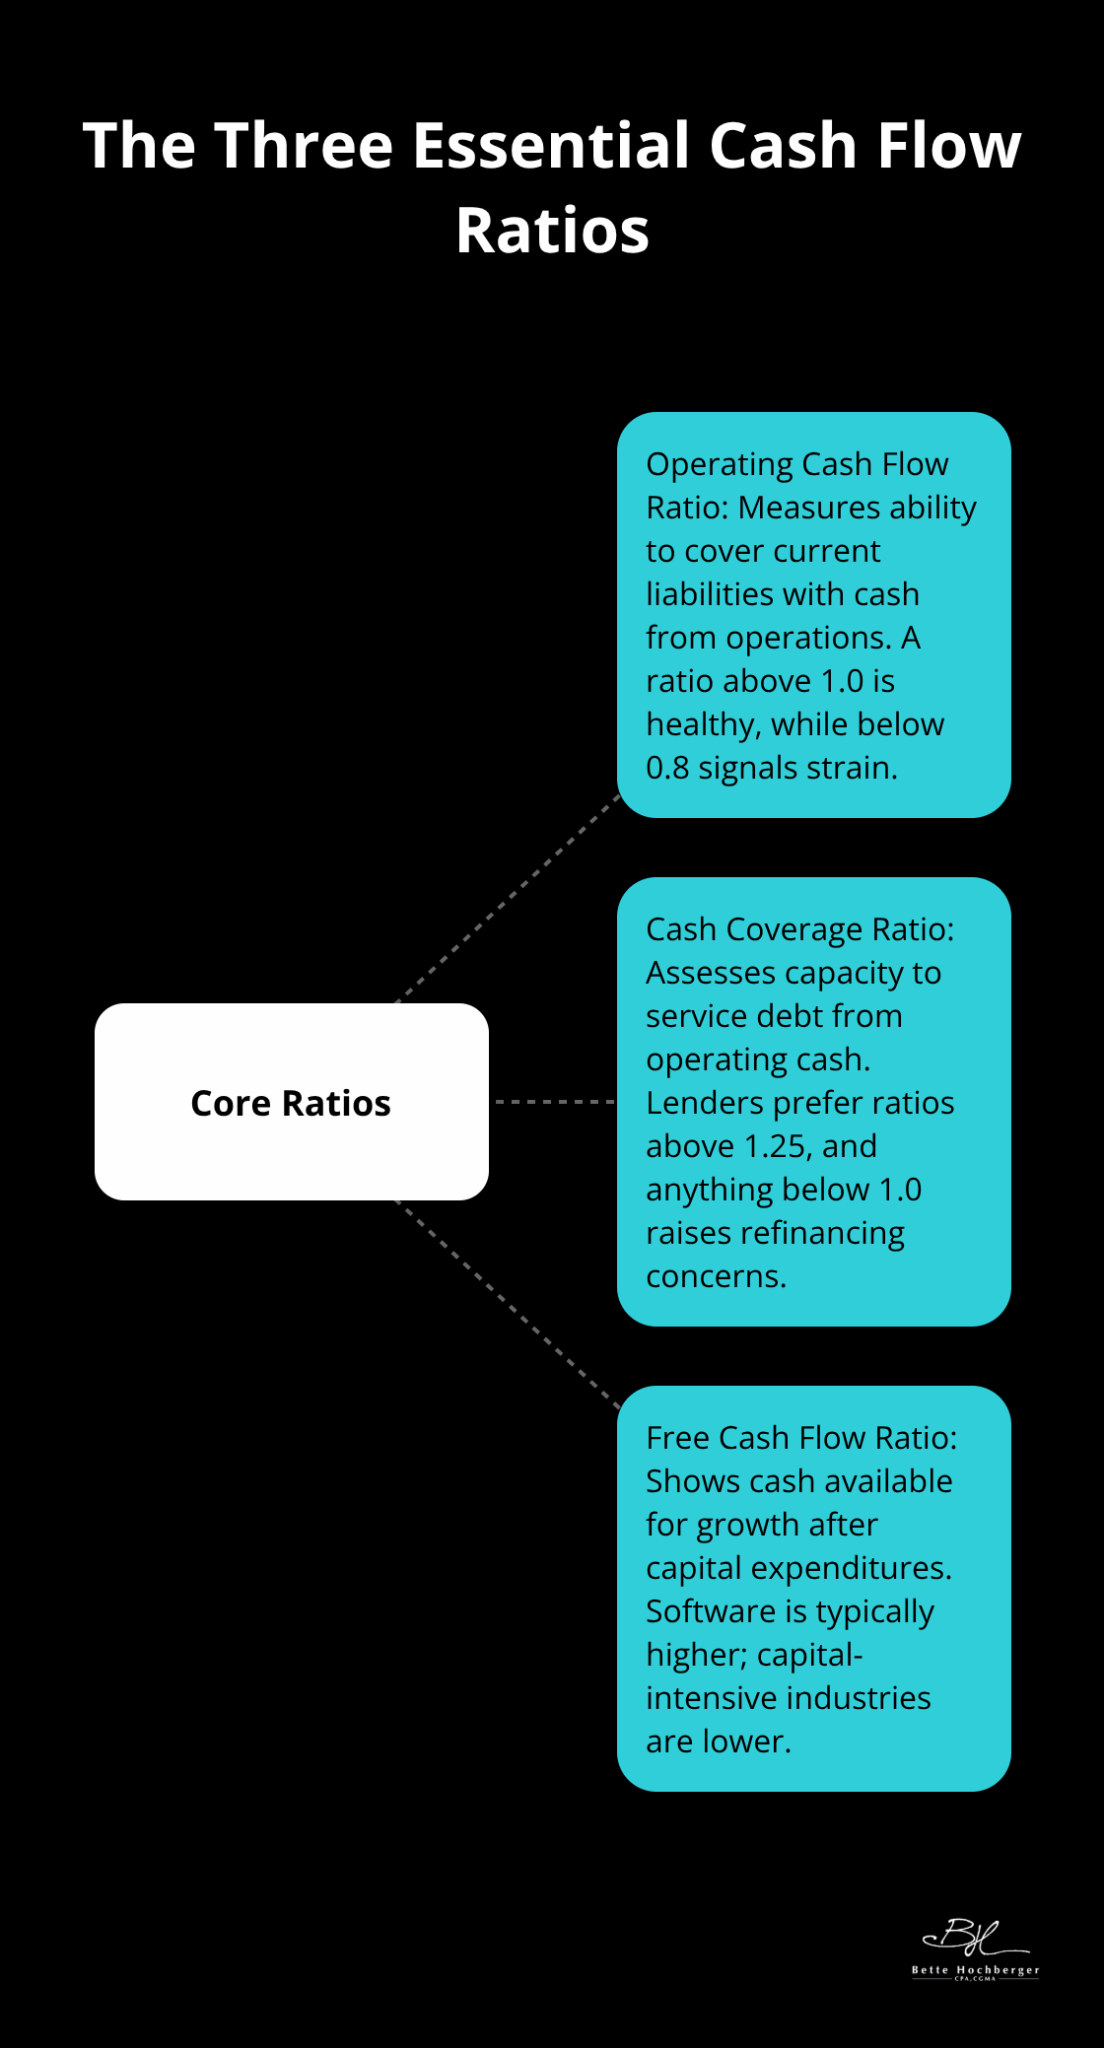
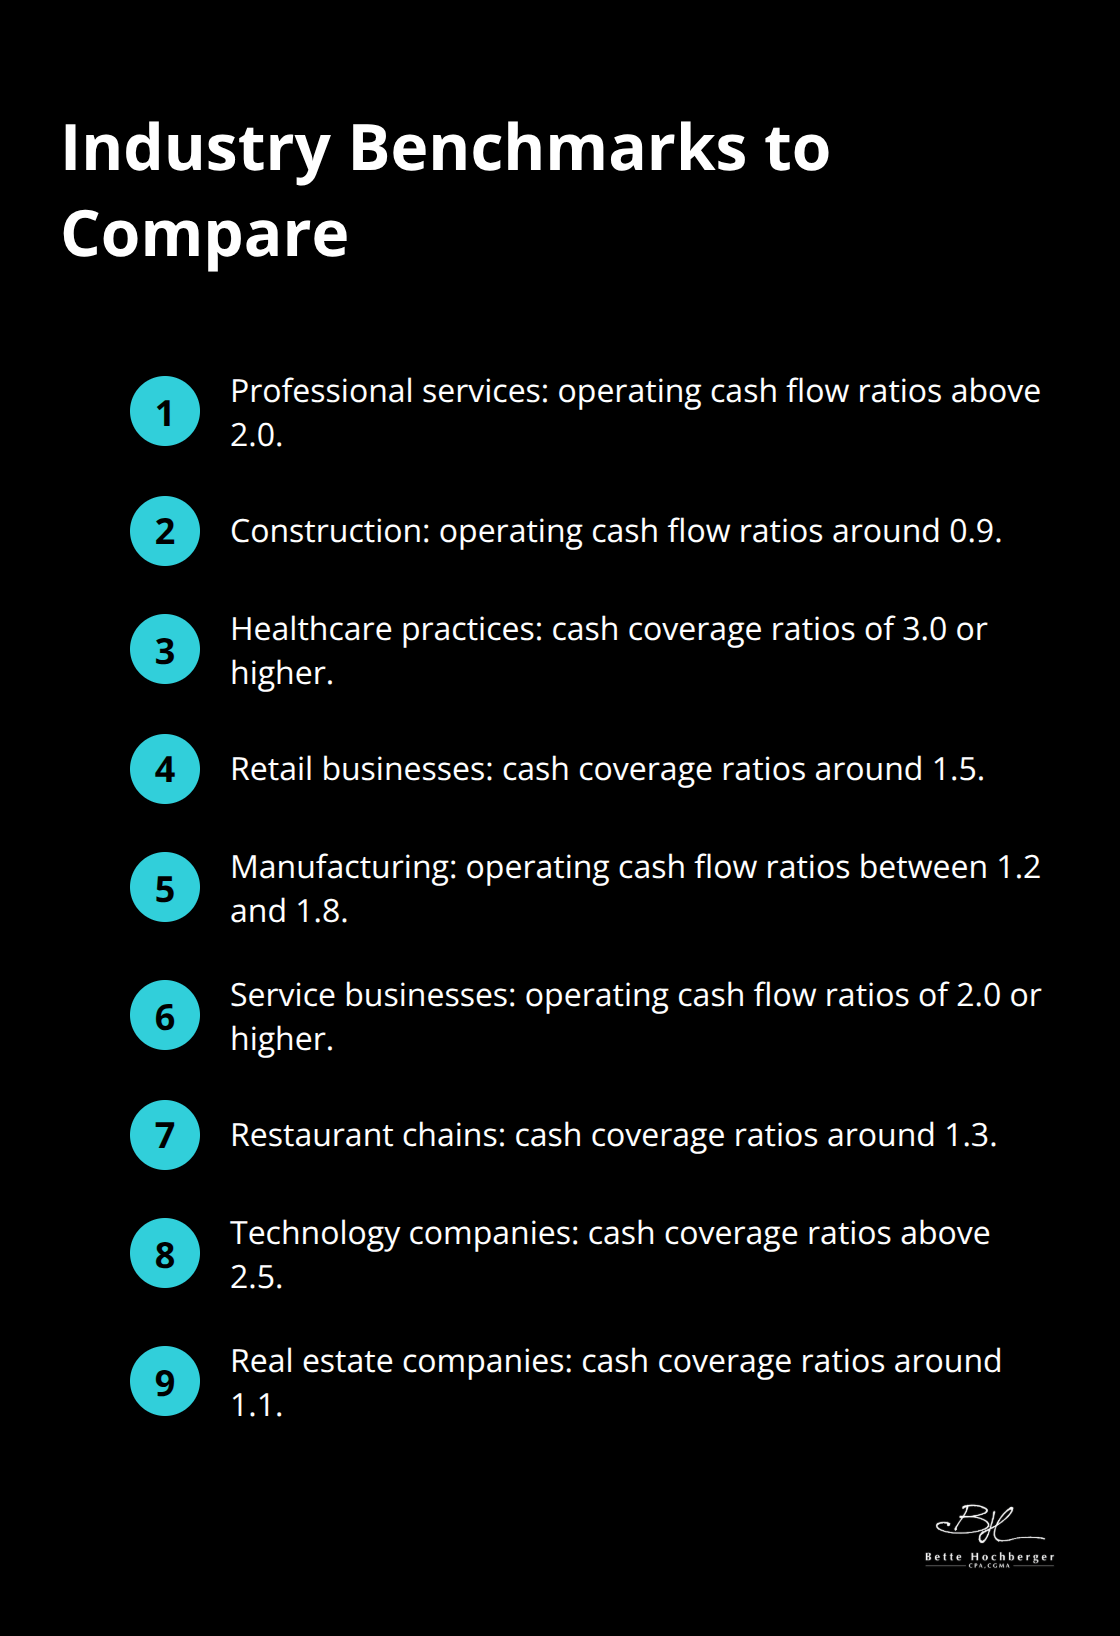
Three specific ratios provide the clearest picture of your company’s financial strength and operational efficiency. The operating cash flow ratio measures your ability to cover current liabilities with cash generated from daily operations. You calculate this by dividing operating cash flow by current liabilities. A ratio above 1.0 indicates healthy cash generation, while anything below 0.8 signals potential payment difficulties. Manufacturing companies typically maintain ratios between 1.2 and 1.8, while service businesses often achieve higher ratios due to lower working capital requirements.
Operating Cash Flow Ratio for Daily Operations
Your operating cash flow ratio directly reflects how well your business converts sales into actual cash. This metric becomes particularly valuable during seasonal fluctuations or economic uncertainty. Technology firms and retail businesses show varying performance levels due to different operational structures and inventory requirements.
Cash Coverage Ratio for Debt Management
The cash coverage ratio measures your ability to service debt payments with operating cash flow. You calculate this by dividing operating cash flow by total debt service payments. Lenders prefer ratios above 1.25, with anything below 1.0 creating immediate refinancing concerns. Real estate companies often operate with lower ratios around 1.1 due to high leverage, while professional services firms maintain ratios above 2.0. This ratio determines your borrowing capacity and influences interest rates on future loans.
Free Cash Flow Ratio for Growth Potential
Free cash flow ratio shows money available for expansion after covering all operational and capital expenses. You can calculate this by starting with cash flows from operating activities, then subtracting capital expenditures and dividing by revenue. Software companies often achieve higher ratios, while capital-intensive industries like manufacturing typically see lower ratios due to equipment requirements.
These ratios mean nothing without proper calculation methods and industry context to interpret the results accurately. Effective cash flow management ensures these metrics remain within healthy ranges for sustainable business growth.
How to Calculate and Interpret Cash Flow Ratios
Start with your cash flow statement to calculate the operating cash flow ratio. Divide cash from operating activities by current liabilities from your balance sheet. A retail business with $500,000 in operating cash flow and $400,000 in current liabilities equals 1.25, which sits in the healthy range. Manufacturing companies should target 1.2 to 1.8, while service businesses often achieve 2.0 or higher due to lower inventory requirements.
Cash Coverage Ratio Calculations
Cash coverage ratio calculation requires you to divide operating cash flow by total debt service payments (including principal and interest). When this ratio drops below 1.0, your business generates insufficient cash to cover debt obligations. Restaurant chains typically operate with ratios around 1.3, while technology companies maintain ratios above 2.5 due to lower capital requirements.
Free Cash Flow Ratio Methods
Free cash flow ratio uses operating cash flow minus capital expenditures divided by total revenue. Software companies achieve ratios of 15-25%, while heavy manufacturing industries struggle to exceed 5%. This metric reveals money available for expansion after you cover all operational and capital expenses.
Warning Signs to Monitor
Watch for trends across consecutive quarters rather than focus on single-period results. Declining patterns signal operational problems before they become financial crises.
Industry-Specific Benchmarks
Industry-specific benchmarks matter more than generic targets because operational structures vary dramatically. Professional services firms maintain operating cash flow ratios above 2.0 due to minimal inventory and equipment needs, while construction companies operate successfully with ratios around 0.9 due to project-based payment cycles. Healthcare practices typically achieve cash coverage ratios of 3.0 or higher, whereas retail businesses hover around 1.5. Compare your ratios against direct competitors rather than broad industry averages for more accurate performance assessment.
Final Thoughts
The three most important cash flow ratios to monitor are operating cash flow ratio, cash coverage ratio, and free cash flow ratio. These metrics provide early warning signs about financial health that profit-based measures often miss. Track these ratios monthly and compare them against industry benchmarks specific to your business sector.
Start to improve your cash flow management when you implement weekly cash flow forecasts and accelerate customer payment terms. Negotiate extended payment periods with suppliers while you maintain strong vendor relationships. Review your capital expenditure plans to align major purchases with peak cash flow periods (this prevents unnecessary strain on your working capital).
Professional financial guidance becomes necessary when your cash flow ratios consistently fall below industry standards or show decline over three consecutive quarters. Complex businesses with multiple revenue streams or seasonal fluctuations benefit from expert analysis to optimize cash flow patterns. We at Bette Hochberger, CPA, CGMA help businesses maintain healthy cash flow ratios through strategic financial management and advisory services.


