
Most business owners receive monthly financial statements but struggle to extract meaningful insights from the numbers. The difference between reading reports and truly understanding them can make or break strategic decisions.
We at Bette Hochberger, CPA, CGMA see this challenge daily. Learning to analyze your financial data like a seasoned CFO transforms how you run your business and spot opportunities before competitors do.
What Do Your Three Financial Statements Actually Tell You
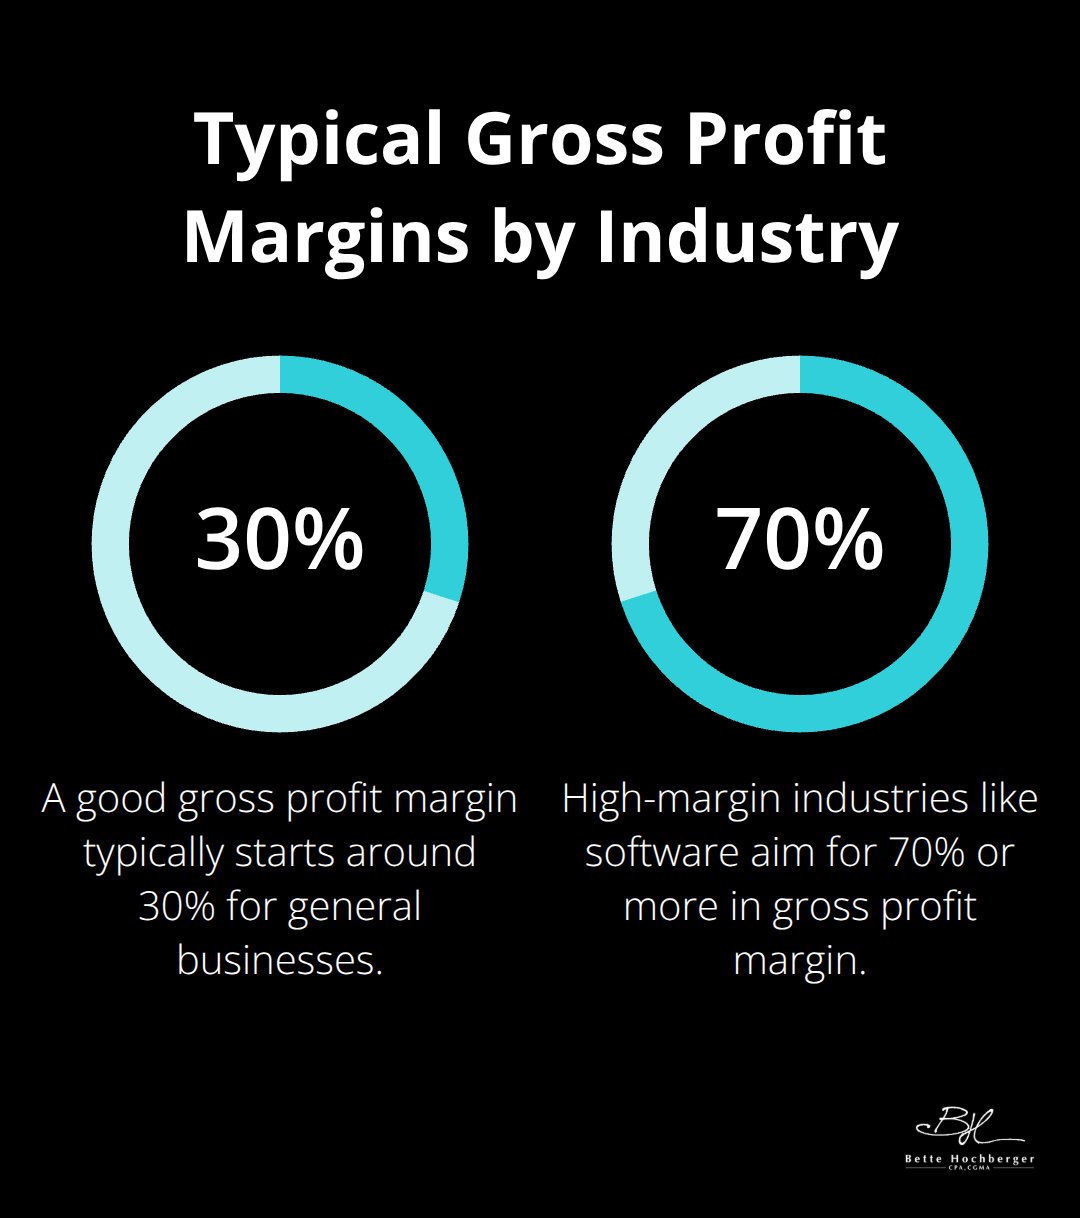
Your income statement shows revenue performance over time, but smart business owners focus on gross profit margins first. A good gross profit margin typically starts around 30%, with high-margin industries like software aiming for 70% or more. Track your revenue per employee monthly – Apple achieves roughly $2 million per employee while Amazon reaches $500,000, which gives you benchmarks for operational efficiency. Watch your expense ratio closely; successful businesses keep this under 30% of total revenue.
Income Statement Power Metrics
Net profit margins reveal your true profitability after all expenses. Manufacturing companies typically see 5-10% margins, while software businesses often achieve 20-25%. Calculate your compound annual growth rate quarterly to spot revenue trends early. Revenue concentration matters too – if one client represents more than 20% of total revenue, you face dangerous dependency risks that threaten long-term stability.
Balance Sheet Health Indicators
The current ratio measures a company’s ability to cover its short-term obligations with its current assets. Inventory turnover rates vary by industry, but retail businesses need 6-12 turns annually while manufacturers require 4-6 turns. Debt-to-equity ratios above 2.0 signal overleveraging (especially for small businesses). Working capital trends predict cash flow problems months ahead – declining capital often precedes serious financial trouble.
Cash Flow Reality Check
Operating cash flow must exceed net income by at least 100% in healthy businesses with minimal inventory. Free cash flow after capital expenditures shows your true earning power – negative free cash flow for more than two consecutive quarters indicates operational problems. Cash conversion cycles measure efficiency; reducing this cycle by even five days can improve cash flow by thousands monthly for growing businesses.
These financial statement insights become even more powerful when you track specific ratios that reveal deeper patterns in your business performance.
Which Financial Ratios Predict Business Success
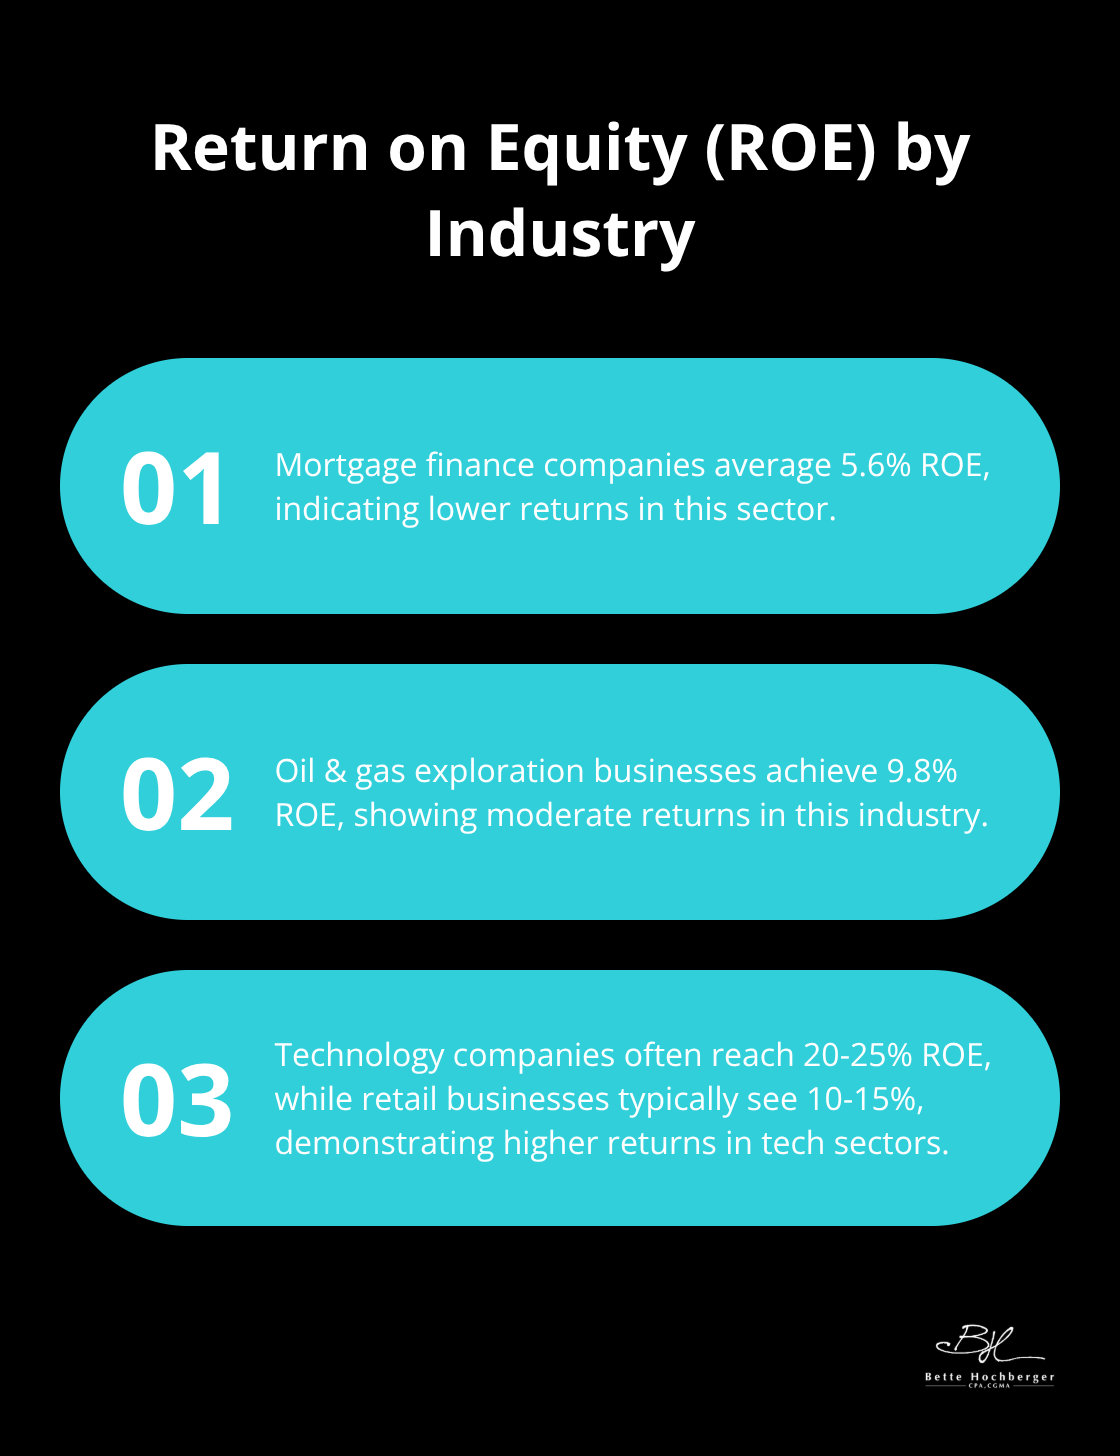
Return on equity measures how effectively you generate profits from shareholder investments. Target ROE varies significantly by industry, with mortgage finance companies averaging 5.6% and oil & gas exploration achieving 9.8%, though technology companies often achieve 20-25% while retail businesses typically see 10-15%. Return on assets reveals management efficiency in using company resources – try for ROA above 5% as anything below 2% suggests poor asset utilization. Gross profit margin stability matters more than absolute numbers; margins that decline over three consecutive quarters signal pricing pressure or rising costs that demand immediate attention.
Profitability Ratios That Drive Growth
Operating profit margin shows your core business efficiency after removing one-time expenses. Manufacturing companies typically maintain 8-12% operating margins while software businesses achieve 25-35%. Net profit margin reveals your bottom-line performance – service businesses should target 10-15% while product companies often see 5-10%. Earnings before interest, taxes, depreciation, and amortization (EBITDA) margin helps compare companies across different tax situations and capital structures.
Liquidity Ratios That Prevent Cash Crises
Quick ratio divides a company’s most liquid assets like cash, cash equivalents, marketable securities, and accounts receivable by current liabilities to show true short-term liquidity – maintain above 1.0 to cover immediate obligations without selling inventory. Current ratio between 1.5-3.0 indicates healthy working capital management, but ratios above 4.0 suggest excess cash sits idle. Days sales outstanding measures collection efficiency; retail businesses should collect within 30 days while B2B companies target 45 days maximum. Cash ratio above 0.2 provides emergency cushion for unexpected expenses or market downturns.
Operational Efficiency Metrics That Maximize Returns
Asset turnover ratio shows revenue generation per dollar of assets – manufacturing companies need 1.5x minimum while service businesses should achieve 2.0x or higher. Inventory turnover varies dramatically by sector; grocery stores turn inventory 15-20 times annually while furniture retailers manage 4-6 turns. Accounts receivable turnover above 12 times yearly indicates strong collection processes. Employee productivity measured through revenue per full-time employee reveals operational strength (track this monthly and benchmark against industry leaders to identify improvement opportunities).
These ratios become even more powerful when you know which warning signs indicate serious financial trouble before problems become irreversible.
What Financial Red Flags Signal Immediate Danger
Negative operating cash flow for two consecutive quarters signals severe operational problems, regardless of reported profits. Companies show positive net income but negative cash flow when they struggle with collection issues or inventory buildup that drains resources. Working capital that declines by 15% or more over six months indicates potential liquidity problems – retail businesses need at least 30 days of operating expenses in working capital while manufacturers require 45-60 days. Days sales outstanding above 60 days suggests collection problems that worsen quickly without intervention.
Cash Flow Warning Signals That Demand Action
Free cash flow turns negative for three consecutive months when capital expenditure outpaces operational cash generation. Accounts payable increases faster than accounts receivable when suppliers demand faster payment while customers delay theirs – this pattern precedes cash shortages by 60-90 days. Cash conversion cycles that extend beyond industry norms create working capital strain (grocery stores should maintain 15-day cycles while software companies target 30 days maximum). Operating cash flow below 80% of net income suggests earnings quality issues or aggressive accounting practices.
Margin Erosion and Revenue Decline Patterns
Gross profit margins that decline by 5% or more over two quarters indicate pricing pressure or costs that management cannot control. Revenue concentration where single customers represent over 25% of total sales creates dangerous dependency risks. Sequential quarterly revenue declines that exceed 10% signal market share loss or industry contraction that requires immediate strategic response. Operating margins shrink while competitor margins remain stable when internal operational inefficiencies affect performance rather than market conditions across the sector.
Leverage and Debt Structure Problems
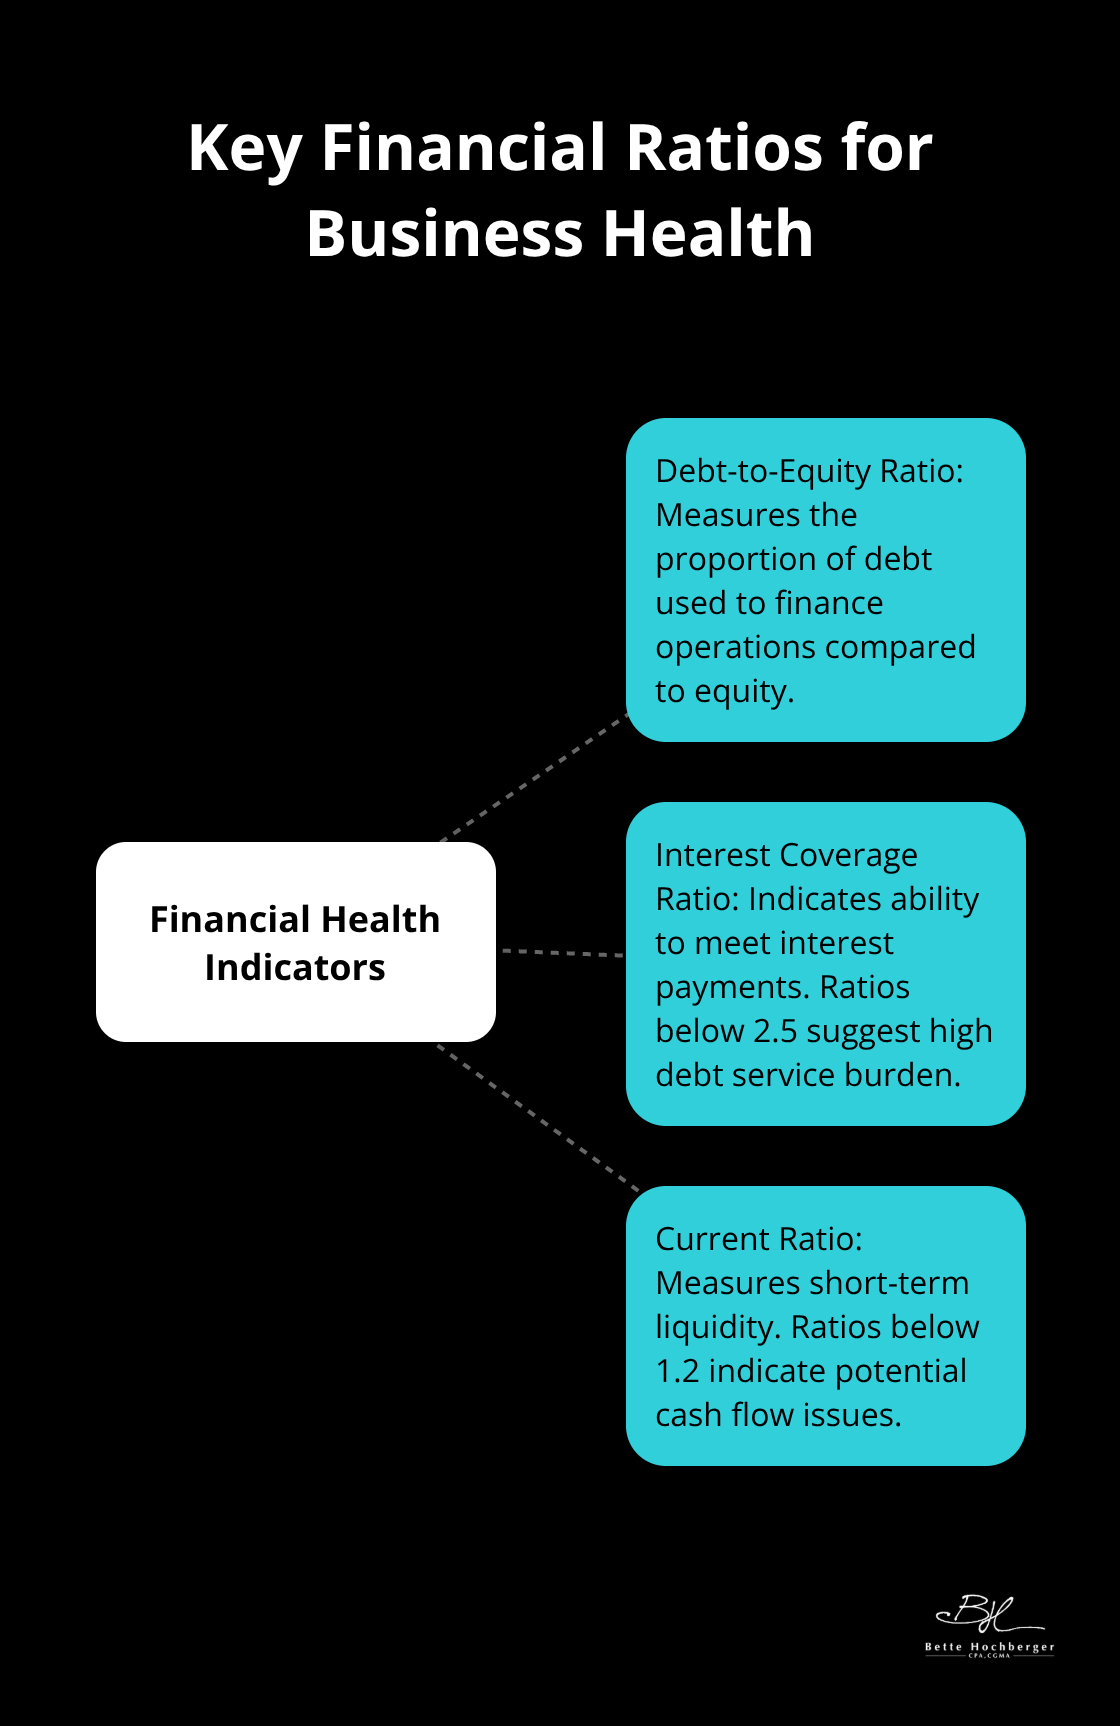
Debt-to-equity ratios help businesses determine how much debt and equity finance operations. Interest coverage ratios below 2.5 times suggest debt service consumes too much operating cash flow. Total liabilities grow faster than assets over 12 months when financial position deteriorates and requires immediate attention. Current ratios below 1.2 indicate insufficient short-term assets to cover immediate obligations without external financing or asset liquidation (this forces businesses to seek emergency funding or sell assets at unfavorable terms).
Final Thoughts
Monthly financial statement reviews should become as routine as checking your bank balance. Schedule these sessions on the same day each month and track the same key metrics consistently. Focus on trends rather than single-month fluctuations – three-month patterns reveal more than isolated numbers.
Complex situations require professional expertise. When debt restructuring becomes necessary, merger opportunities arise, or tax implications affect financial decisions, specialists prevent costly mistakes. Multi-entity structures, international transactions, and regulatory compliance issues demand professional guidance that saves money long-term (especially for growing businesses with complex operations).
Start with a simple dashboard that tracks your top five ratios monthly. Revenue per employee, gross profit margin, current ratio, days sales outstanding, and free cash flow provide comprehensive business health insights. We at Bette Hochberger, CPA, CGMA help business owners transform raw financial statements into strategic advantages through professional accounting services and strategic tax planning.


